
Field Response Dashboards
Supervisor panels tracking mean response time, first-visit resolution, and crew routing across districts. Delivered as interactive files your team can open daily.
Ho Chi Minh City · Since 2019
We design and build custom analytics panels for maintenance crews, utility dispatchers, and regional operations leads who need clear visibility into response times, backlog, and crew availability — without wading through spreadsheets.
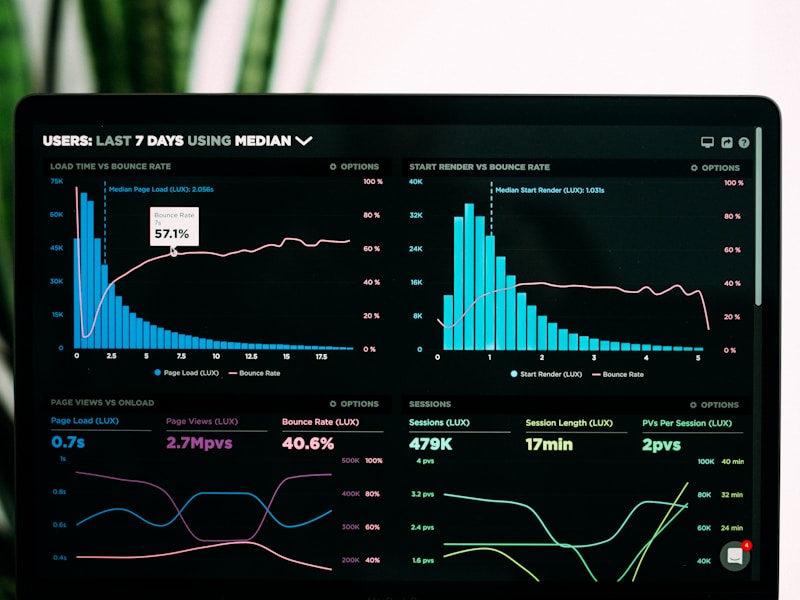
Each commission starts with your existing service logs, dispatch records, and supervisor interviews. The result is a purpose-built panel — not a generic template — tuned to how your crews actually work.
Supervisor panels tracking mean response time, first-visit resolution, and crew routing across districts. Delivered as interactive files your team can open daily.

Weekly or monthly summary views of open tickets, aging brackets, and priority queues — formatted for morning stand-ups and regional review meetings.

Shift-aware views showing which crews are on route, on break, or available for reassignment — built from your roster and GPS check-in data.
Most projects run four to six weeks from kickoff to handoff, depending on data complexity and the number of supervisor personas involved.
We sit with your dispatch lead and review sample service logs, ticket exports, and the questions supervisors ask every morning.
Two to three layout options with real (anonymised) data. Your team marks what is useful, what is noise, and what is missing.
Final panel built, tested with two supervisors in live conditions, then delivered with a short usage guide and one follow-up session.
Our district lead used to spend forty minutes each morning reconciling three spreadsheets. The panel Panel Anchorhub built cuts that to under ten — and the aging-ticket chart alone changed how we allocate crews on Mondays.— Tran Minh K., Operations Supervisor, Binh Thanh district maintenance contractor
The crew-availability view took a bit of getting used to because our roster data was messy at first. Once we cleaned up check-in timestamps, it became the first screen our dispatchers open.— Le Thi H., Dispatch Coordinator, regional water utility subcontractor
Tell us about your service logs, team size, and the decisions your supervisors make daily. We respond within two business days.
Request a scoping call